Discover why jump height lies during force plate testing and learn how to track true athlete neuromuscular fatigue using key force-time curve metrics.
A coach monitoring morning readiness often looks straight at vertical jump height. When an athlete hits 52 centimeters on Monday and repeats 52 centimeters on Thursday, the staff assumes the central nervous system is fresh. That conclusion is dangerous. Athletic bodies are masters of mechanical compensation, finding ways to maintain output even when neurochemical and muscular systems are heavily drained.
Understanding countermovement jump fatigue monitoring requires peeling back that gross output. As reported by Sideline Sports on September 18, 2026, measuring jump height alone masks athlete neuromuscular fatigue on dual force plates. Their research revealed that fatigued athletes preserve gross jump height by altering countermovement depth and prolonging ground contact time. Relying purely on flight time produces false positives, sending exhausted players into intense loading blocks right before soft-tissue injuries strike.
Why measuring jump height alone masks athlete neuromuscular fatigue on dual force plates
Vertical jump height is calculated either from flight time or takeoff velocity derived from impulse. Both metrics ignore the path the athlete took to produce that impulse. When systemic fatigue sets in, the motor cortex alters recruitment patterns to achieve the required end goal. An athlete might drop three inches deeper into a countermovement squat to create extra time to produce force, yet achieve an identical jump height.
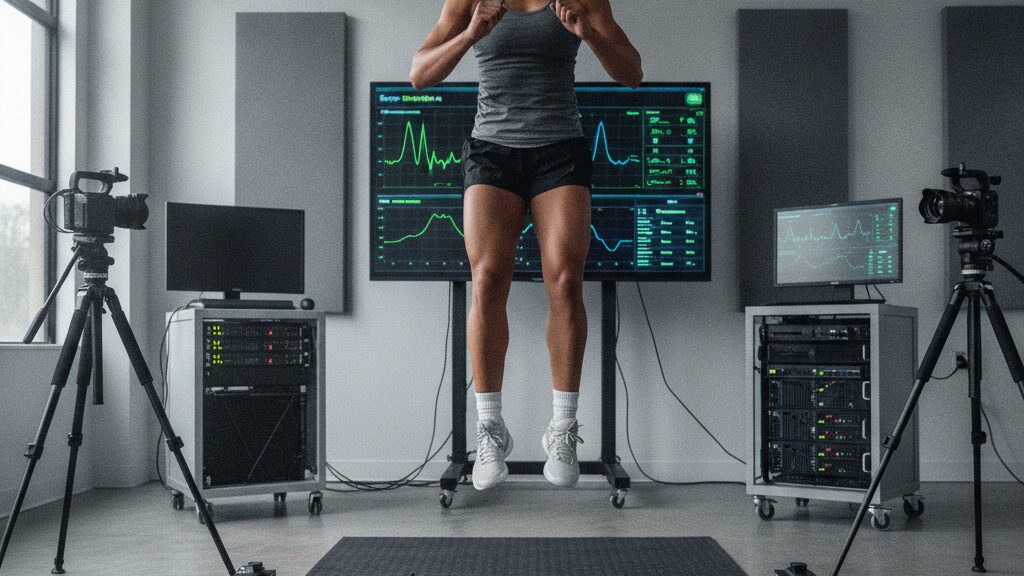
Dual force plates sample vertical ground reaction force at 1,000 Hertz. That frequency captures millisecond-by-millisecond shifts in force development that an optical mat or contact pad completely misses. In our practical training sessions at the ISST High Performance Centre, we regularly observe athletes whose gross jump height remains stable while their force-time curves show clear signs of neuromuscular impairment.
When an athlete cannot recruit high-threshold motor units rapidly, they substitute raw force with mechanical duration. Total impulse equals force multiplied by time. If force capacity drops by 15%, the athlete lengthens the duration of the braking and propulsive phases. The total area under the curve stays identical. The jump height looks fine, but the neuromuscular strategy has broken down.
The mechanics of movement compensation in the countermovement jump
Neuromuscular fatigue impairs both cross-bridge cycling and stretch-reflex sensitivity. When fast-twitch motor units suffer excitation-contraction coupling failure, the muscle-tendon complex loses stiffness. To compensate, the central nervous system modifies the kinematic profile.
The athlete increases knee flexion during the eccentric dip. A deeper countermovement increases the distance over which positive work can be performed. This kinematic adjustment buys time, allowing slower motor unit pools to contribute to total impulse. If a practitioner records only jump height, the monitoring protocol registers a false negative.
Look at braking phase duration. In an uninjured, rested state, an elite basketball player might complete the braking phase in 220 milliseconds. Under heavy acute fatigue, that same player may stretch the braking phase to 310 milliseconds. Jump height reads 48 centimeters in both trials. Treating those two jumps as identical invites catastrophic patellar tendon or hamstring strains during subsequent high-intensity sprinting sessions.
Critical metrics for countermovement jump fatigue monitoring
Strength and conditioning specialists must move beyond jump height to detect acute and chronic strain. The primary diagnostic indicators reside within the eccentric braking and concentric propulsive phases of the force-time trace.
Flight time to contraction time ratio
Flight time to contraction time, commonly expressed as the FT:CT ratio or modified reactive strength index (RSI-modified), divides jump height or flight time by total movement duration. Total contraction time starts the moment the athlete initiates the unweighting phase and ends at toe-off.
When an athlete compensates by extending movement time, contraction time rises sharply. Even if jump height stays constant, the FT:CT ratio drops significantly. Research indicates that a decline exceeding an athlete’s smallest worthwhile change (SWC)—typically between 5% and 8%—flags true neuromuscular fatigue.
Eccentric deceleration rate of force development
Eccentric deceleration rate of force development measures how rapidly an athlete stops downward momentum at the transition point. It reflects eccentric rate of force development and reactive muscle stiffness. Fast eccentric deceleration protects soft-tissue structures during sudden change of direction.
When central fatigue degrades motor drive, this eccentric metric drops before concentric force or jump height reflects any change. Tracking eccentric deceleration gives coaches a 48-hour head start on managing neuromuscular breakdown.
Concentric mean force and peak power
Concentric mean force reflects the average force produced from the lowest point of the countermovement up to takeoff. While peak force can be noisy due to sudden impact spikes, mean force offers a steady evaluation of muscular work. A downward shift in mean concentric force combined with extended duration confirms an inability to produce rapid contractile tension.
How dual force plate asymmetry reveals unilateral neuromuscular suppression
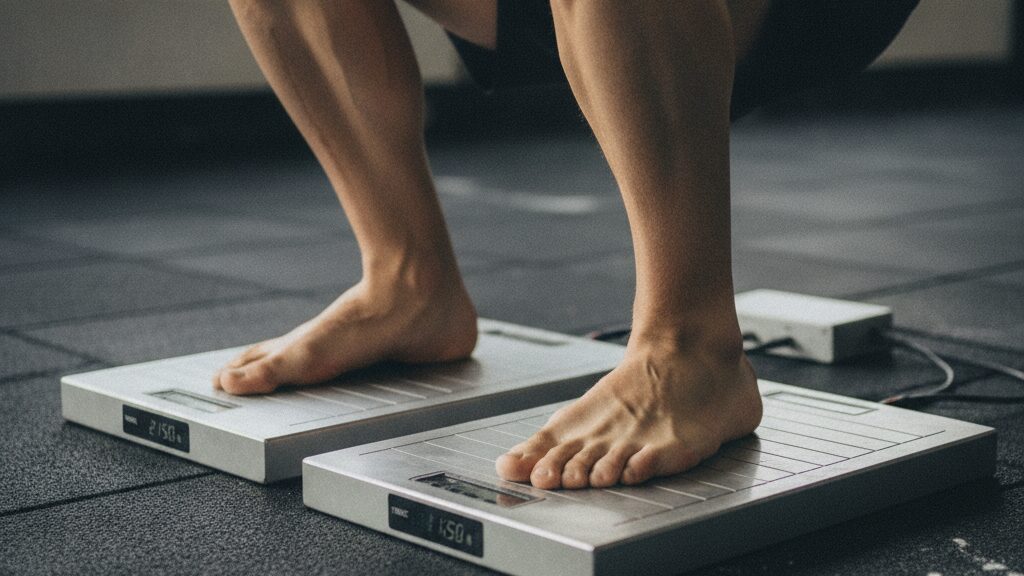
Single force plates hide side-to-side compensation. An athlete carrying an overloaded right Achilles tendon or an irritated left hamstring will shift load toward the healthy limb while keeping total system impulse steady. Dual force plates expose this hidden unloading strategy immediately.
In laboratory testing at the Masters Programme in Sports Sciences, we monitor bilateral asymmetry across each jump phase independently. An asymmetry of 4% during quiet standing is normal. However, an eccentric braking asymmetry exceeding 10% indicates protective inhibition from the motor cortex.
Athletes frequently land with greater asymmetry than they display during takeoff. A player might mask unilateral weakness on the way up, but the fatigued limb fails to absorb impact symmetrically upon landing. Dual plate data captures these landing impulse discrepancies, preventing secondary knee injuries before they sideline players.
Setting up an objective baseline: coefficients of variation and smallest worthwhile change
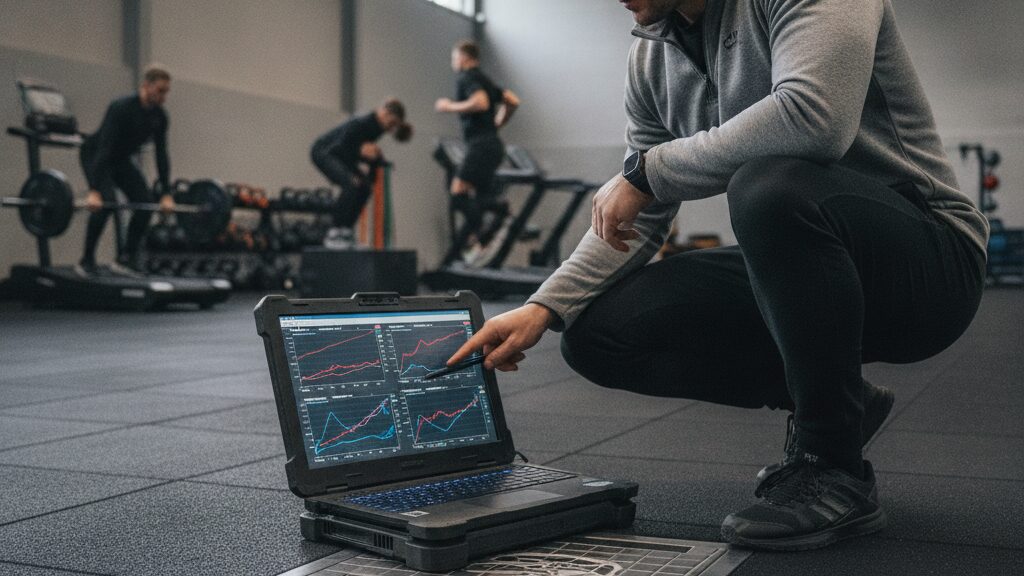
Data without statistical context leads to reactionary programming. Practitioners often pull an athlete from practice over normal biological variation. To monitor true fatigue, every department must calculate individual athlete baseline variability.
The smallest worthwhile change serves as your analytical threshold. Calculate the between-day coefficient of variation across a minimum of three trials conducted during an un-fatigued baseline state. In practice, a standard protocol looks like this:
- Conduct baseline testing across three separate rested mornings following an off day.
- Record three valid countermovement jumps per testing session with hands placed firmly on the hips.
- Calculate the mean and standard deviation for FT:CT, eccentric deceleration rate of force development, and jump height.
- Establish the baseline threshold as 0.3 multiplied by the between-day standard deviation.
When an athlete registers a decline greater than their individual threshold in two successive sessions, intervention is mandatory. At ISST, students learning through the Distance Diploma in Strength & Conditioning learn that statistical rigor separates genuine sports science from guesswork.
Practical training adjustments when dual plates detect hidden strain
Identifying fatigue is useless without an actionable programming response. Dual force plate diagnostics should immediately inform daily load management, barbell velocity selection, and practice volume.
If an athlete demonstrates stable jump height but a 9% drop in eccentric deceleration rate of force development, avoid heavy plyometrics and rapid change-of-direction drills. Their stretch-shortening cycle efficiency is compromised. Subjecting tendons to high-velocity stretch loading in this state spikes patellar and hamstring injury rates.
Modify the strength session to emphasize submaximal concentric work, isometric holds, or tempo-based resistance training. Isometrics allow the athlete to maintain high neural output without the high mechanical strain associated with rapid eccentric loading. Reduce total sprint volume by 30% to 50% for the session.
If both jump height and contraction time decline, central nervous system fatigue is profound. The autonomic nervous system requires recovery. Pull the athlete from maximal intensity sprinting and heavy compound lifts. Replace the stimulus with extensive mobility, light aerobic flush work, and targeted recovery protocols.
Building sports science workflows for athletic monitoring
Running a force plate station requires standardized testing protocols. Small changes in arm movement or verbal instruction distort force-time traces instantly.
Enforce a strict hands-on-hips constraint unless your program explicitly tests an arm swing countermovement jump. Arm swing introduces variable momentum that masks lower-limb neuromuscular changes. Keep verbal instructions identical: cue athletes to jump as fast and as high as possible. Changing cues from “jump as high as you can” to “jump as quickly as you can” alters contraction time by up to 18% independently of physical fatigue.
Aspiring coaches studying in our BSC Sports Sciences learn these measurement standards directly. Standardized protocols ensure that force plate data reflects physiological changes in the athlete rather than procedural errors by the practitioner.
Frequently Asked Questions
Why does jump height stay unchanged when an athlete is fatigued?
Athletes alter their movement strategy by dipping deeper and spending more time on the ground. This extended contact time generates enough total impulse to preserve jump height despite reduced muscular power.
What is the most sensitive metric for countermovement jump fatigue monitoring?
The modified reactive strength index (RSI-modified) or flight-time-to-contraction-time ratio detects fatigue fastest. It accounts for both jump height and the time required to complete the movement.
How often should athletes jump on force plates to track fatigue?
Testing two to three times per week provides reliable trend data. Testing should occur at the start of training sessions under identical, rested conditions.
Why are dual force plates better than contact mats for jump testing?
Contact mats only measure flight time and estimate jump height. Dual force plates record force across time at high frequencies, exposing neuromuscular compensation and bilateral asymmetries.
What is a normal asymmetry percentage during a countermovement jump?
Asymmetries between 3% and 5% are typical in healthy athletic populations. Asymmetries exceeding 10% during braking or landing indicate significant neuromuscular compensation.
How do arm movements alter countermovement jump test results?
Arm swings introduce variable mechanical momentum that masks lower-body neuromuscular strain. Testing with hands fixed on hips ensures measurements reflect lower-limb and trunk capacity.
Can rate of force development drop while peak force remains normal?
Yes, acute neuromuscular fatigue degrades rapid cross-bridge recruitment earlier than peak tension capacity. Athletes often hit normal peak force simply by taking longer to develop it.
How does force plate fatigue data integrate with GPS player tracking?
Force plate data assesses internal neuromuscular readiness, while GPS tracks external mechanical workload. Combining both tools helps sports scientists identify when external workloads cause dangerous internal fatigue.
Now that measuring jump height alone masks athlete neuromuscular fatigue on dual force plates, upgrade your team’s monitoring protocols and pursue professional sports science training with ISST. Explore our UGC recognized classroom and distance programs to master advanced athletic profiling, or schedule an educational consultation with our admissions team today—completely free, with no obligation.
The Institute of Sports Science & Technology (ISST), founded in 2008 in Pune, is India’s premier education center dedicated exclusively to sports management and sports science. By integrating cutting-edge academic pedagogy, robust industry partnerships, and scientific methodologies, ISST develops top-tier professionals equipped to lead the modern sports, fitness, and wellness industries.
- Founded in 2008 as a pioneer in Indian sports education
- Offers specialized programs in Sports Management & Sports Science
- Strong industry partnerships with leading sports leagues, teams, and organizations
- Faculty comprises expert sports scientists, veteran coaches, and industry researchers
- Dedicated placement cell with extensive national and international support